
Menu & food cost · 8 min read
Menu engineering: sell the dishes that pay for the kitchen
Classify every dish by popularity and contribution margin, then decide what to feature, reprice, rework, or remove.
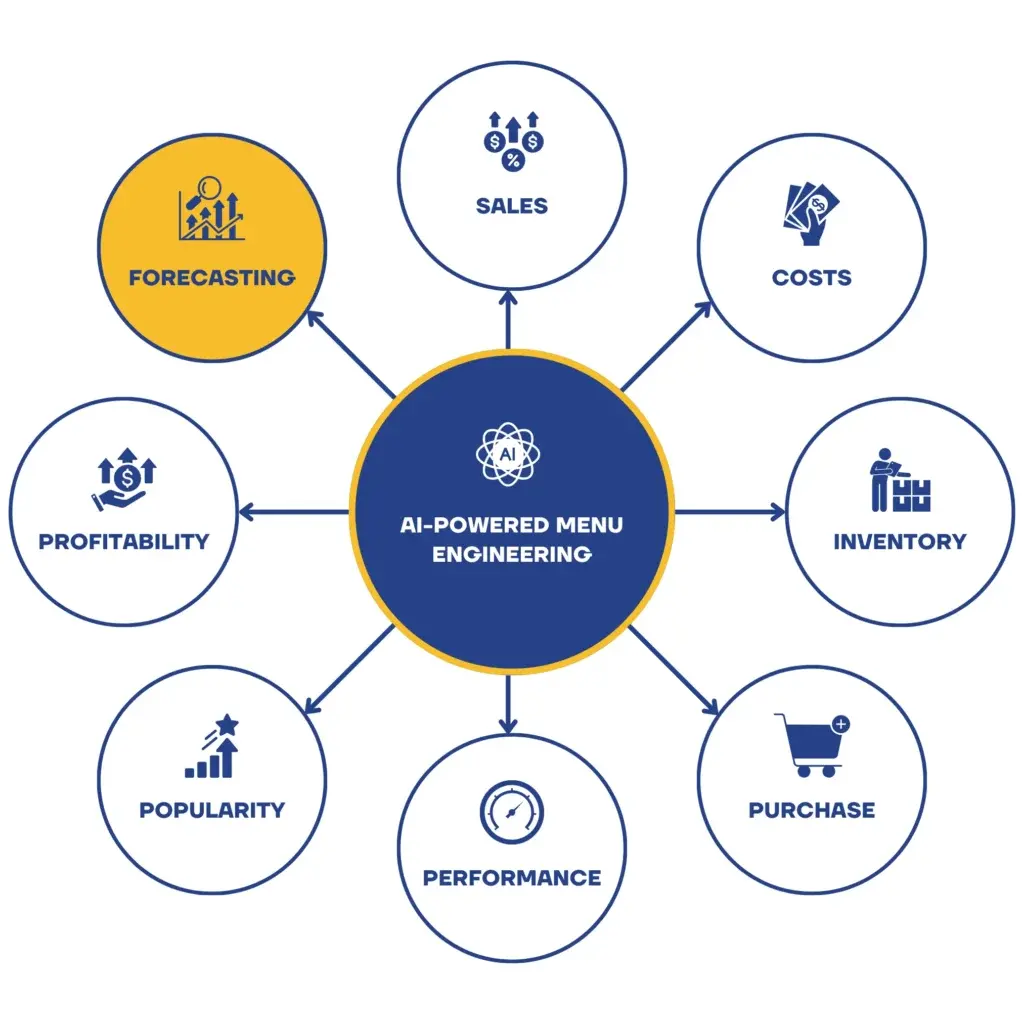
In this article:
01
Food cost percentage is not the whole story
A steak at 38% food cost can earn more cash per plate than a pasta at 22%. Menu engineering looks at contribution margin — selling price minus plate cost — alongside how often each dish sells. You bank margin in currency, not in percentages, so a dish's value is its margin multiplied by its volume.
02
Sort every dish into four groups
Compare each dish with the category average for popularity and margin. Stars sell well and earn well: protect them. Plowhorses sell well but earn little: adjust portion, garnish, or price carefully. Puzzles earn well but rarely sell: improve description, placement, or staff recommendation. Dogs do neither: rework or remove them to simplify prep and inventory.
03
Cost the recipe as it is actually plated
The analysis is only as good as the plate cost. Use the standard recipe with yields and trim loss, not the invoice price of the main protein. Re-cost after supplier price changes; in a volatile market a dish can move from Star to Plowhorse without a single change in the kitchen.
04
Use the digital menu to test placement
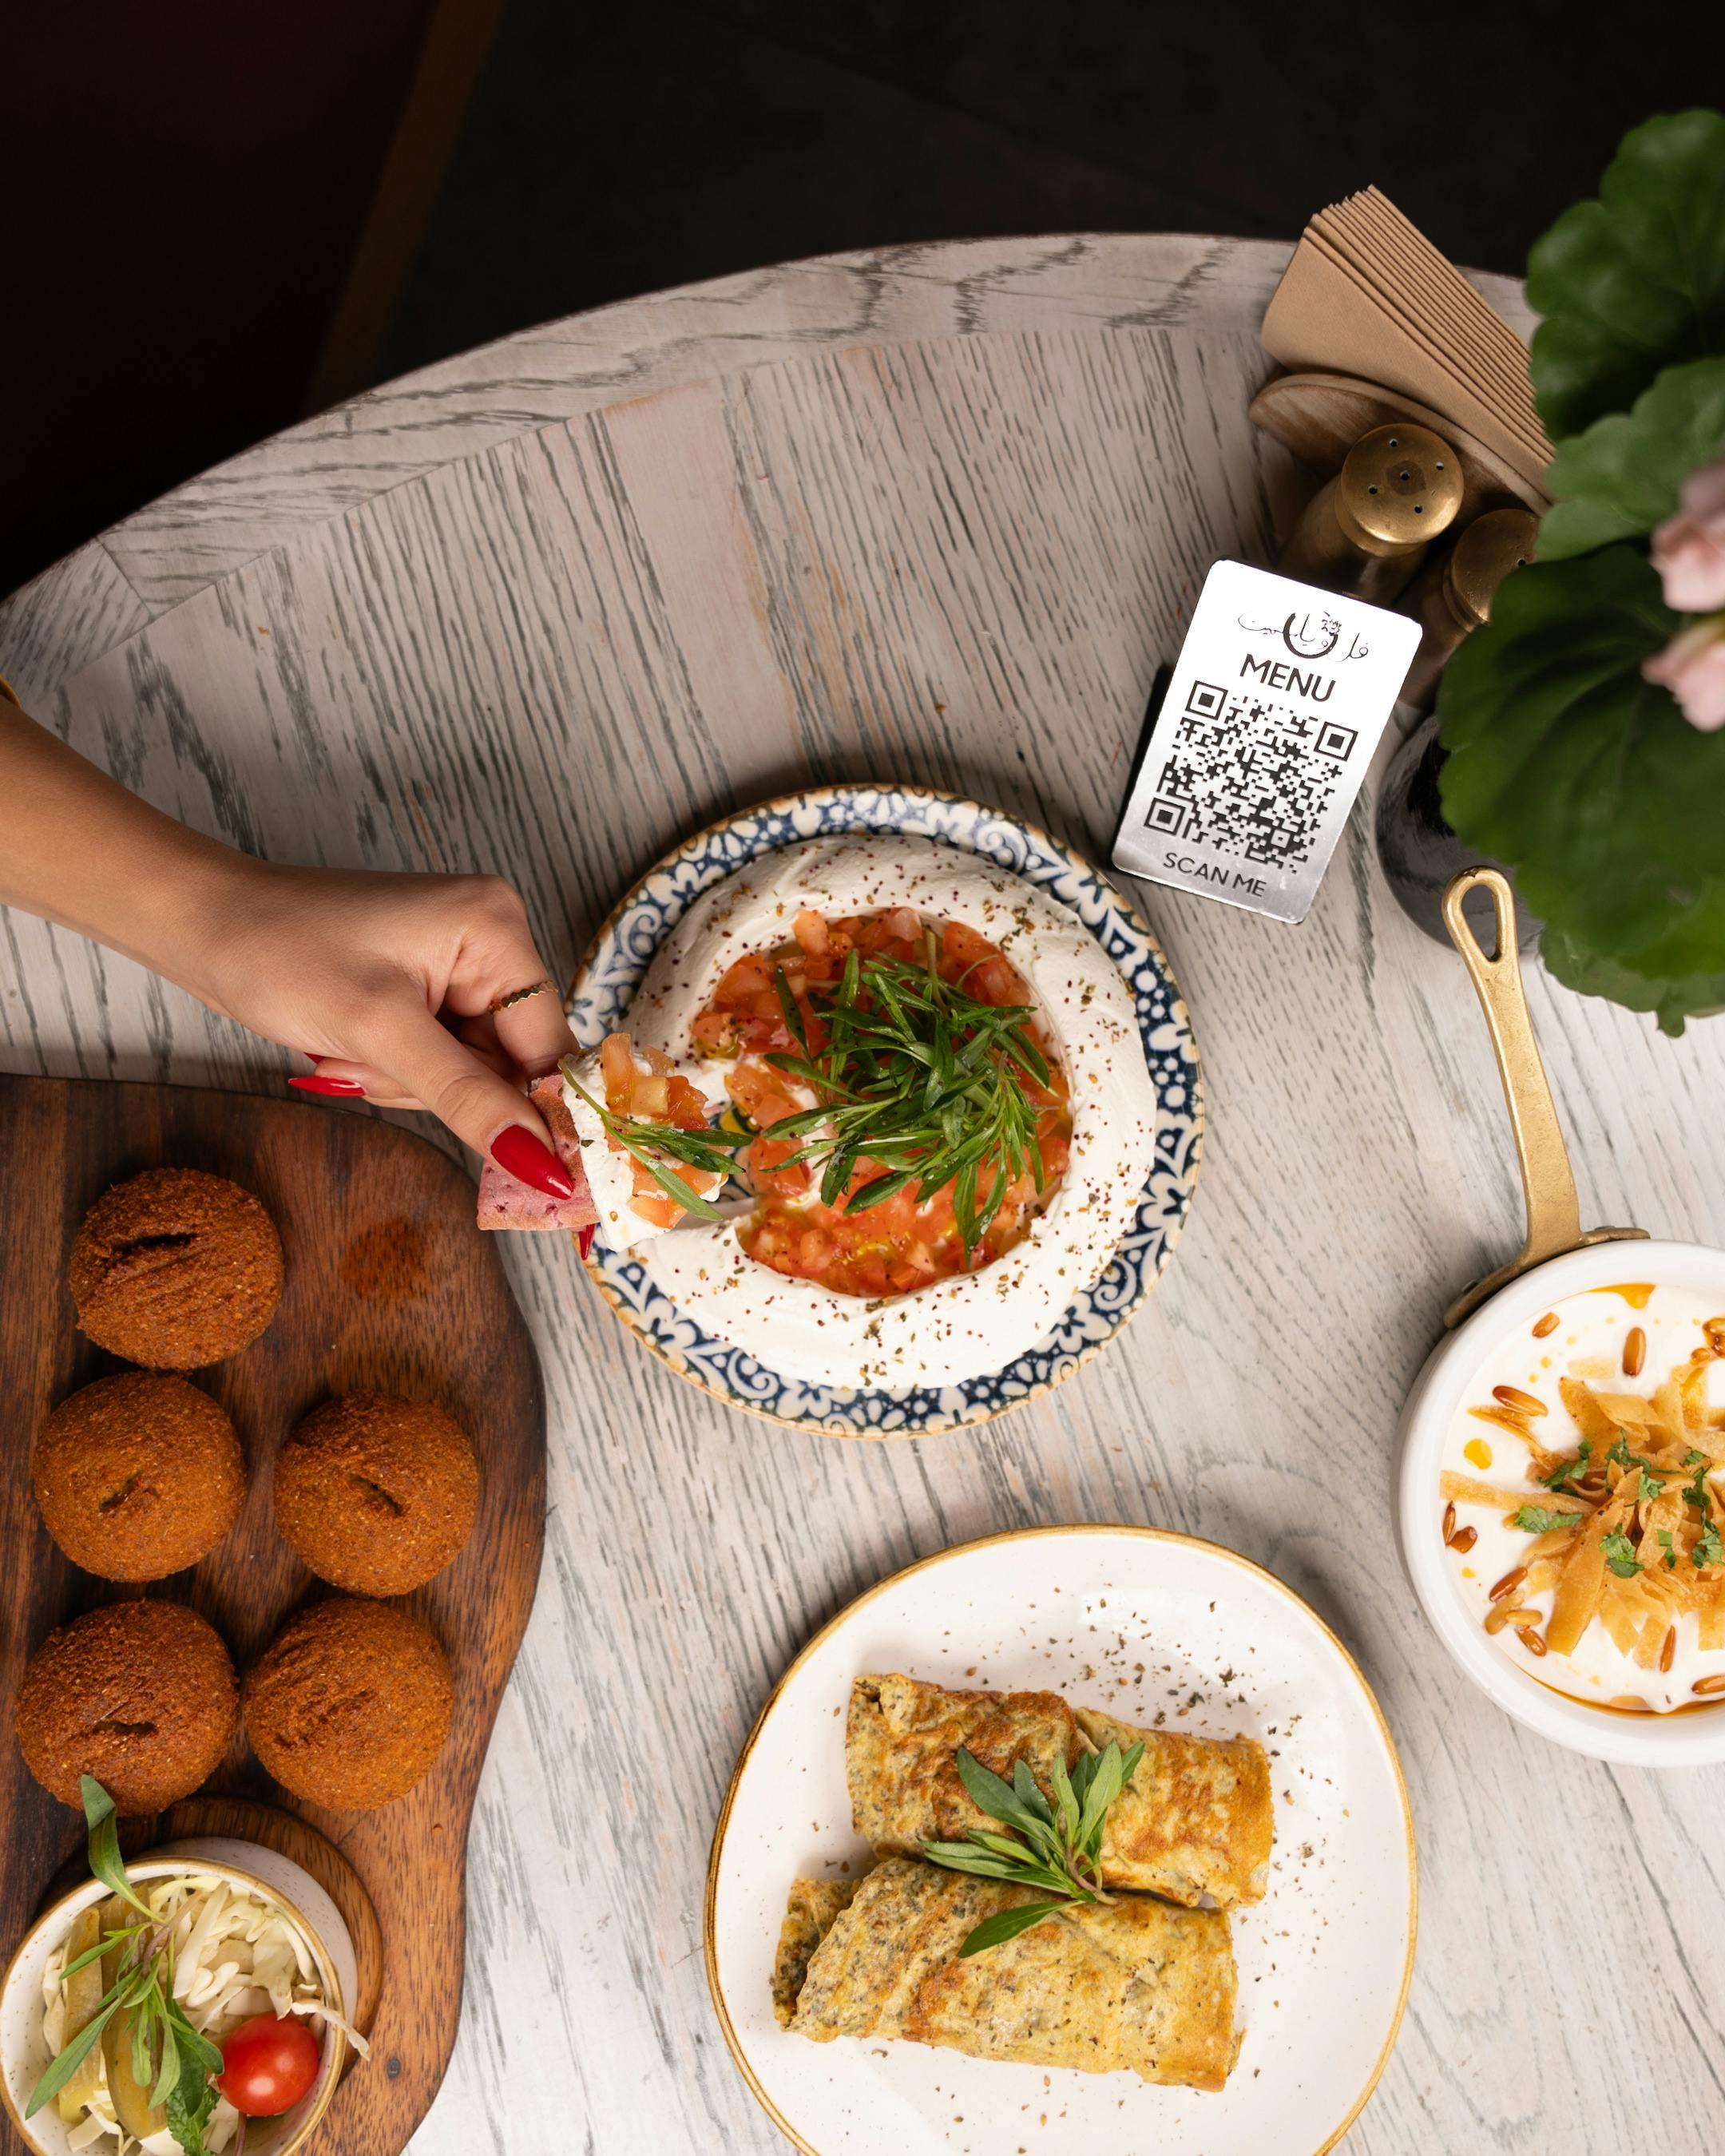
Digital and QR menus reveal something paper never could: which dishes guests look at and do not order. A high view-to-order gap on a Puzzle suggests the description or photo is not doing its job. A clear photo, a short origin story, or a staff pick label is a cheaper fix than a price cut.
05
Run the review every menu cycle
Repeat the classification each season or menu change, using at least four weeks of sales. Change one variable at a time for a dish — price, position, or description — so you can see which change moved the number. Keep the guest in the decision: a Dog that anchors a loyal group's visit may deserve its place.
Put this into practice
- Export four weeks of item sales and current plate costs
- Calculate contribution margin and popularity per dish
- Pick one Puzzle to feature and one Dog to rework
- Compare menu views with orders after the change
Journey context
This article supports the Order stage
Explore the complete journey to see how this decision connects with the guest experience and the next team handoff.
Explore the guest journey →Continue reading

See what this looks like in your venue
Talk through the guest moments and signals that matter most to your team.
Book a demo →